If your PostgreSQL queries are acting sluggish, the EXPLAIN command is your best friend. It reveals the database's execution plan, helping you find and fix performance issues by showing how your queries actually run versus what's estimated.
If you're diving into PostgreSQL and find your queries aren't performing as expected, understanding the `EXPLAIN` command is incredibly valuable. This handy tool gives you a peek behind the curtain, showing exactly how PostgreSQL plans to execute your database statements. Think of it as a roadmap for your queries, helping you pinpoint potential slowdowns before they become major problems.
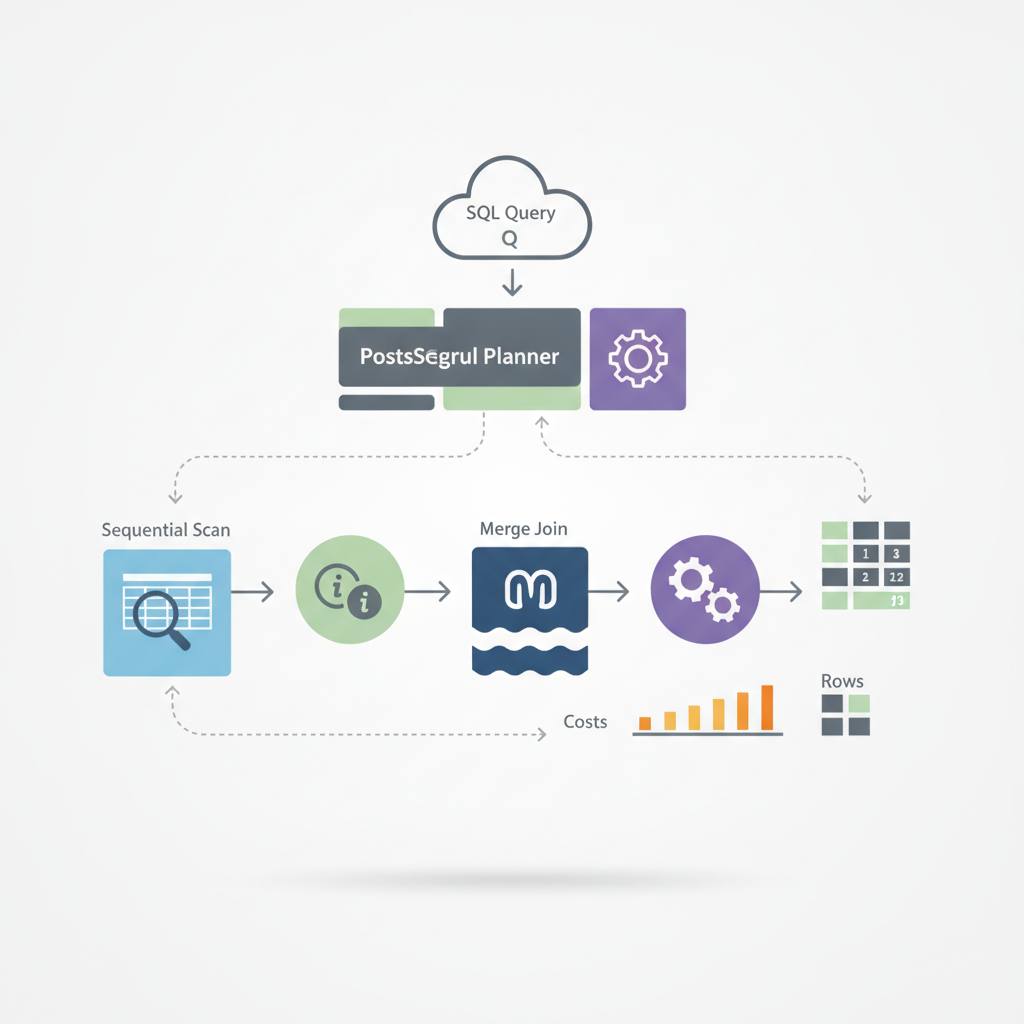
When you run `EXPLAIN` on a query, you get a tree-like output. This tree describes the steps PostgreSQL intends to take: from fetching data (called 'scans' at the 'leaves' of the tree) to combining or sorting it (joins, sorts, aggregates, higher up). The final result of your query is shown at the very top. Each step in this plan comes with useful figures: an estimated cost (for starting and completing the step), the estimated number of rows, and the estimated average width of those rows.
It's super important to remember that these initial figures—cost, rows, and width—are *estimates*. They're the planner's predictions based on database statistics and configuration, not actual measurements of time or data. This is why `EXPLAIN` alone is great for seeing the plan without actually running the query, which can be useful if you're worried about its impact.
For real-world diagnostics, though, you'll want to use `EXPLAIN ANALYZE`. This version actually runs your query and then adds observed (actual) metrics to the output: the true time taken, the actual number of rows processed, and how many times certain loops ran. When using `EXPLAIN ANALYZE`, pay close attention to any significant mismatches between the planner's estimates and the observed values. If PostgreSQL estimated 100 rows but actually processed 10,000, that's a red flag! Such discrepancies often point to outdated statistics or suboptimal configuration, warranting further investigation. While one plan doesn't tell the whole story, it's a powerful starting point to ensure your queries run smoothly and efficiently.
When you run `EXPLAIN` on a query, you get a tree-like output. This tree describes the steps PostgreSQL intends to take: from fetching data (called 'scans' at the 'leaves' of the tree) to combining or sorting it (joins, sorts, aggregates, higher up). The final result of your query is shown at the very top. Each step in this plan comes with useful figures: an estimated cost (for starting and completing the step), the estimated number of rows, and the estimated average width of those rows.
It's super important to remember that these initial figures—cost, rows, and width—are *estimates*. They're the planner's predictions based on database statistics and configuration, not actual measurements of time or data. This is why `EXPLAIN` alone is great for seeing the plan without actually running the query, which can be useful if you're worried about its impact.
For real-world diagnostics, though, you'll want to use `EXPLAIN ANALYZE`. This version actually runs your query and then adds observed (actual) metrics to the output: the true time taken, the actual number of rows processed, and how many times certain loops ran. When using `EXPLAIN ANALYZE`, pay close attention to any significant mismatches between the planner's estimates and the observed values. If PostgreSQL estimated 100 rows but actually processed 10,000, that's a red flag! Such discrepancies often point to outdated statistics or suboptimal configuration, warranting further investigation. While one plan doesn't tell the whole story, it's a powerful starting point to ensure your queries run smoothly and efficiently.